A04: Statistics, experiments, and uncertainty in measurements
On this page
- A. Prerequisites and observable goals
- B. The central question: what does a finite sample justify?
- C. Confidence intervals quantify a procedure, not certainty about one interval
- D. Paired measurements preserve the comparison
- E. Hypothesis tests do not measure the probability that a hypothesis is true
- F. Regression and causal claims
- G. Independent practice
- H. Complete solutions: A04
- I. Retention and readiness
A. Prerequisites and observable goals#
A03: expectation, variance, conditional probability, and distributions; A02 for regression geometry.
Distinguish a population parameter from an estimate, interpret confidence intervals and tests correctly, design a paired experiment, and report effect sizes and limitations instead of a single persuasive number.
Level: Degree core; introductory inference, not a full statistics specialization.
B. The central question: what does a finite sample justify?#
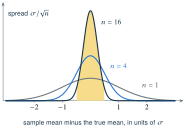
A sample is observed data. A parameter is a property of a specified population or model. An estimator is a rule that computes a proposed parameter value from a sample. For independent identically distributed observations with finite variance , the sample mean has expectation and variance . Averaging reduces this kind of sampling variability, but it does not remove systematic measurement error, selection bias, or an incorrect model.
Measuring only successful requests estimates latency conditional on success, not latency and reliability for all attempted requests. Measuring only after caches are warm describes a warm-cache workload. Discarding slow observations because they “look like noise” can erase precisely the tail that users experience. Define the population, workload, inclusion policy, and units before collecting results.
C. Confidence intervals quantify a procedure, not certainty about one interval#
When the population variance is known and normality holds, or an appropriate large-sample approximation is justified,
is a familiar approximate 95% confidence interval for a mean. When variance is estimated from an independent normal sample, use a Student critical value with degrees of freedom and standard error . The small-sample result relies on its assumptions; replacing every difficult latency distribution with a normal one is not justified by notation.
The frequentist 95% statement concerns repeated samples and the interval-building procedure: under the assumptions, 95% of such intervals cover the fixed parameter. It does not mean 95% of observations lie inside this interval, and it is not automatically a 95% posterior probability that the parameter lies in this particular realized interval. A prediction interval for a future observation is a different object and usually wider. A Bayesian credible interval answers another question after specifying a prior and likelihood.
The central limit theorem explains why normalized sample means can approach a normal distribution under appropriate independence and moment conditions. It is an asymptotic theorem, not a guarantee that any sample of size 30 is adequate. Heavy tails, strong dependence, or nonstationary workloads require more care. [PROB][NIST]
D. Paired measurements preserve the comparison#
Compare an old and new implementation on the same workload instance, and define in milliseconds. Positive values favor the new implementation. Workload difficulty affects both measurements, so pairing can remove some shared variation. Randomize or alternate execution order to reduce systematic warmup and drift effects. Pairing does not eliminate thermal, scheduling, or order effects automatically.
For differences ms, the mean reduction is 10 ms. The sample variance is , so the standard error is ms. Using the supplied two-sided 95% critical value 3.182 for three degrees of freedom gives approximately ms. The result is conditional on independent approximately normal pair differences. Four pairs are weak evidence for diagnosing an arbitrary real latency distribution; the example teaches the calculation, not a recommended universal sample size.
A bootstrap resamples observed pairs with replacement, computes the statistic for each resample, and uses the distribution of those statistics to approximate sampling uncertainty. Resampling old and new values independently would destroy pairing. A simple percentile interval can be inaccurate in small samples or biased/skewed settings. Correlated time-series observations may require block-based methods rather than treating each request as an independent draw. The lab explicitly uses the simpler independent-pairs model.
E. Hypothesis tests do not measure the probability that a hypothesis is true#
A null hypothesis might specify zero mean paired difference. A test statistic measures how incompatible the observation is with the null model. A -value is the probability, under that null model and its assumptions, of obtaining a result at least as extreme according to the test’s rule. It is not and not the probability that the result was “caused by chance.” Failing to reject does not prove equality or practical equivalence. Equivalence requires a specified tolerance and an appropriate analysis.
Effect size asks how much changed: milliseconds saved, error rate reduced, or a standardized difference. A huge sample can make a tiny, unimportant difference statistically detectable. A small sample can leave a practically important difference uncertain. Report an effect estimate with uncertainty and the engineering requirement it is meant to satisfy. “Statistically significant” and “fast enough” answer different questions.
Multiple attempts change the evidence. If 20 independent null tests each use a 5% false-positive rate, the probability of at least one false rejection is . Repeatedly tuning on the test set and reporting only the best outcome is another form of selection. Predeclare the main comparison, retain failed trials, and use separate validation and final evaluation data when developing models or choosing configurations.
F. Regression and causal claims#
Linear regression models a response as . Least squares estimates coefficients by minimizing a specified loss. Its geometric solution does not itself establish that increasing causes to change. A confounder may influence both. For example, more powerful devices might both select higher graphics settings and achieve higher frame rates; an observational positive association does not prove that raising graphics quality improves speed.
A randomized controlled comparison assigns conditions independently of potential outcomes, subject to practical design constraints. Blocking by device or workload and pairing repeated runs can improve precision. Blind evaluation, fixed metrics, and a documented exclusion policy reduce opportunities for accidental bias. Privacy and consent remain relevant when measurements come from people rather than synthetic fixtures. In this book, all fixtures are synthetic and no real customer data is used.
G. Independent practice#
F foundation C standard course work T transfer S optional stretch L runnable lab or project. Attempt the complete set before opening its solutions.
A report says: “Our 95% confidence interval is [8,12] ms, so 95% of requests take between 8 and 12 ms.” Identify the error and state what information would be needed to describe individual request latency.
For paired reductions ms, calculate the sample mean, sample variance, standard error, and interval using the supplied critical value 3.182. State two assumptions and one limitation.
A test yields . Does this establish that two implementations are equally fast? Explain what an equivalence claim would additionally require.
Design a comparison of two pathfinding implementations on a laptop. Specify workloads, pairing, order, warmup policy, metrics, incorrect-result handling, and reporting. Explain why a single fastest run is an inadequate summary.
Implement seeded paired bootstrap estimation in statistics_lab.py. Resample pair differences, report the mean reduction and a percentile interval, and reject mismatched, too-small, or nonfinite input. Test a constant 10 ms reduction, where every resample has the same mean. Explain why an interval of [10,10] from that fixture is not a universal certainty statement.
Optional small hints
A04.01: a mean and an individual observation are different random quantities. A04.04: both implementations must solve the same valid problems correctly before their times are compared.
H. Complete solutions: A04#
Compare the first step where your work differs. A corrected answer is not yet an independent success.
A04.01Show solution
An interval for the mean is not a range of observations
The statement confuses uncertainty in an estimated population mean with the spread of individual requests. A confidence interval describes the mean-estimation procedure under its assumptions. Individual latency needs a distributional description such as a histogram, empirical quantiles, and perhaps a justified prediction interval. Requests can have a tightly estimated mean near 10 ms and still include a substantial slow tail. Define the workload and whether failures are included before interpreting either summary.
Back to A04.01A04.02Show solution
Keep squared units and standard errors distinct
The mean is 10 ms. Squared deviations sum to 8, so and ms. The standard error is ms. The margin is ms; the interval is about ms. The exact small-sample interpretation assumes independent normally distributed pair differences. A limitation is that four pairs cannot reveal many types of skew, nonstationarity, or rare stalls. This calculation quantifies uncertainty under a model, not every source of benchmark error.
Back to A04.02A04.03Show solution
Insufficient evidence is not equivalence
A -value of 0.20 means this test did not reject its null at a 0.05 threshold; it does not prove zero difference. The test might have low power or high noise. A practical equivalence claim first needs a prespecified acceptable difference, such as within ms, and an analysis showing the uncertainty is sufficiently contained within that band under suitable assumptions. Also verify both implementations’ correctness and that the workload represents the intended use.
Back to A04.03A04.04Show solution
An exemplar reproducible comparison
Create a seeded suite of grids spanning small and large dimensions, sparse and dense walls, reachable and unreachable goals. Validate path costs against BFS on the unit-cost cases. Pair both implementations on each identical instance, alternate or randomize order, and state whether one excluded warmup per implementation is used. Measure wall time with a monotonic clock, expansions or candidate counts, peak memory when available, and incorrect or failed runs separately. Report repetitions, individual or summarized paired differences, median and tail behavior, build settings, machine description, and limitations. Never remove a wrong result and report the remaining speed as though correctness were unchanged. The fastest run is especially sensitive to favorable scheduling and does not describe typical or tail behavior. Other defensible designs may stratify workloads instead of aggregating them; justify the weighting.
Back to A04.04A04.05Show solution
Reference implementation
"""A04.05: paired bootstrap of mean change. An approximation, not a guarantee."""
import math
import random
import statistics

def paired_bootstrap(before: list[float], after: list[float],
                     repetitions: int = 2000, seed: int = 42) -> dict:
    if len(before) != len(after) or len(before) < 2:
        raise ValueError("at least two matched pairs required")
    if any(not math.isfinite(x) for x in before + after):
        raise ValueError("finite observations required")
    if type(repetitions) is not int or repetitions < 100:
        raise ValueError("at least 100 resamples required")
    differences = [b - a for b, a in zip(before, after)]
    rng = random.Random(seed)
    n = len(differences)
    means = sorted(statistics.mean(rng.choices(differences, k=n))
                   for _ in range(repetitions))
    lo = means[math.ceil(0.025 * repetitions) - 1]
    hi = means[math.ceil(0.975 * repetitions) - 1]
    return {"mean_reduction": statistics.mean(differences),
            "percentile_95_interval": [lo, hi],
            "pairs": n, "resamples": repetitions, "seed": seed}

if __name__ == "__main__":
    print(paired_bootstrap([10, 13, 12, 15, 11], [8, 10, 10, 11, 10]))
The same sampled index selects a complete pair through its already computed difference. This retains within-pair correspondence while assuming pairs can be resampled independently. The default seed fixes the pseudo-random resampling sequence. When every observed difference is 10, every bootstrap mean is 10 and the percentile endpoints coincide. That is a property of this degenerate observed sample and estimator, not proof that all unobserved workloads have exactly the same reduction. Input validation and reproducibility are part of the lab; a claim about a population still requires a credible sampling design and adequate data.
Back to A04.05I. Retention and readiness#
Retrieve the distinction between expectation and an observed value, and between covariance and independence. Advance when you can explain a confidence interval without turning it into an observation range or posterior probability, and can defend an experiment’s sampling and exclusion policy.